Free study guide
How to Read a Sectional Chart for Part 107
A step-by-step FAA-source guide to using a sectional chart for Part 107 preflight planning while confirming current restrictions and authorization needs.
Last reviewed: October 15, 2026
Always confirm with current FAA sources (faa.gov/uas).
What to carry into your next study session
- Start with the current chart and the FAA Aeronautical Chart User’s Guide so you can identify airspace boundaries, airport information, and other charted features.
- A dashed blue boundary generally depicts Class D airspace, while other boundary colors and line styles must be read with the chart legend and the surrounding information.
- Use sectional information with current NOTAMs, TFRs, and the applicable FAA authorization process; it is a planning reference, not permission to fly.
- UAS Facility Maps can inform an airspace-authorization request, but they are not authorization to fly; confirm approval and current restrictions before operating.
FAA testing update
October 26 change in effect
Since October 26, 2026, the FAA says Instrument Rating Airplane (IRA) and Unmanned Aircraft General – Small (UAG) tests include image-based questions that are not found in the test supplements. The FAA has not set a date for removing testing supplements from test centers; candidates will continue to have access until removal, with ample notice beforehand. Read the FAA advisory for details.
The October 26 date is when the test-content change begins, not a chart-edition effective date. These training excerpts use the FAA Seattle Sectional dated October 29, 2026; the chart prints an effective window from 0901Z October 29 through 0901Z December 24, 2026. As of this October 15 review, the FAA edition schedule still lists September 3 as current and October 29 as next, so the October edition is not yet effective. Each caption identifies its edition and FAA source.
These original chart-reading practice items are for study only; they are not actual FAA questions and do not predict what will appear on a test.
For the full explanation of the current test format and what the official notice does—and does not—confirm, read the dedicated October 26 image-question update.
Original practice item 1: Airspace line style
In this Seattle Sectional legend excerpt, which line style depicts Class D airspace?

- A. Blue dashed line
- B. Solid magenta line
- C. Magenta dashed line
Answer: A. The chart legend labels the blue dashed sample “Class D Airspace.” Its magenta solid sample is Class C; the magenta dashed sample marks Class E surface airspace.
Original practice item 2: Runway symbol
The legend pairs these filled airport symbols with which runway category?

- A. Airports with runways other than hard-surfaced
- B. Hard-surfaced runways 1,500 feet to 8,069 feet long
- C. Hard-surfaced runways over 8,069 feet or a group of shorter runways
Answer: B. The text beside the filled circle symbols gives the range as 1,500 to 8,069 feet. The legend uses open circles for airports with runways other than hard-surfaced.
Original practice item 3: Maximum elevation figure
In the chart quadrangle shown, what elevation does the blue “67” maximum elevation figure represent?
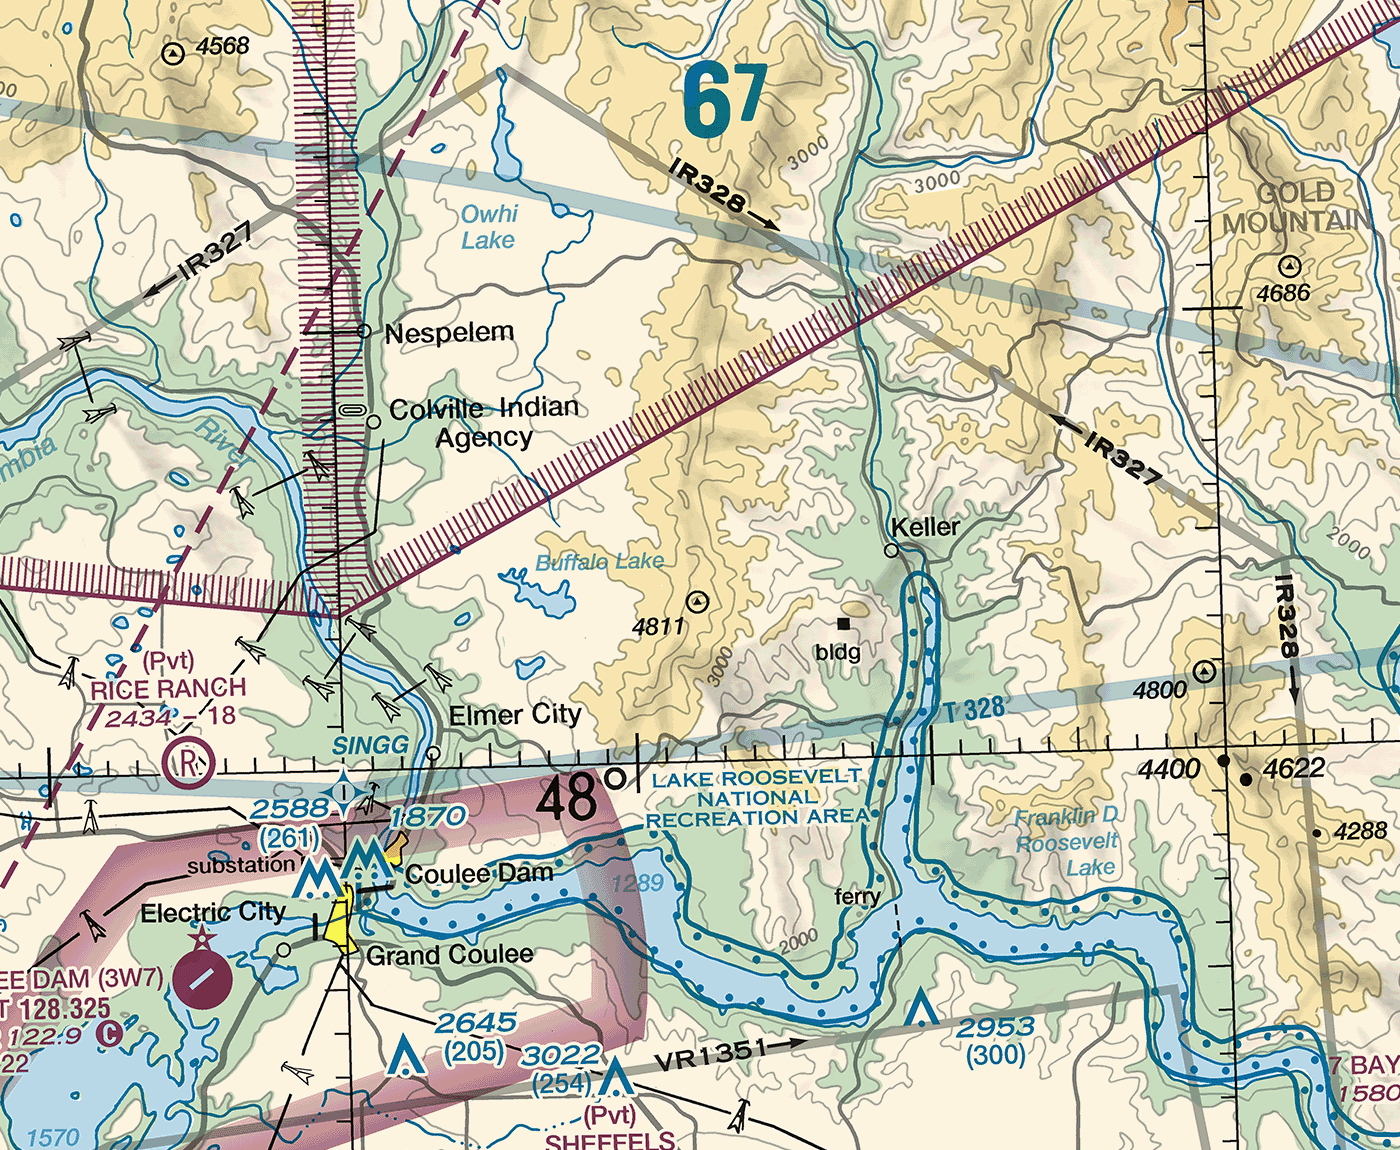
- A. 670 feet above mean sea level
- B. 6,700 feet above mean sea level
- C. 67,000 feet above mean sea level
Answer: B. The chart’s MEF note says these figures are in hundreds of feet above mean sea level. Multiply 67 by 100: the figure is 6,700 feet MSL.
Original practice item 4: Reading the MEF legend
The Seattle Sectional legend gives “125” as an example maximum elevation figure. What altitude does that figure represent?
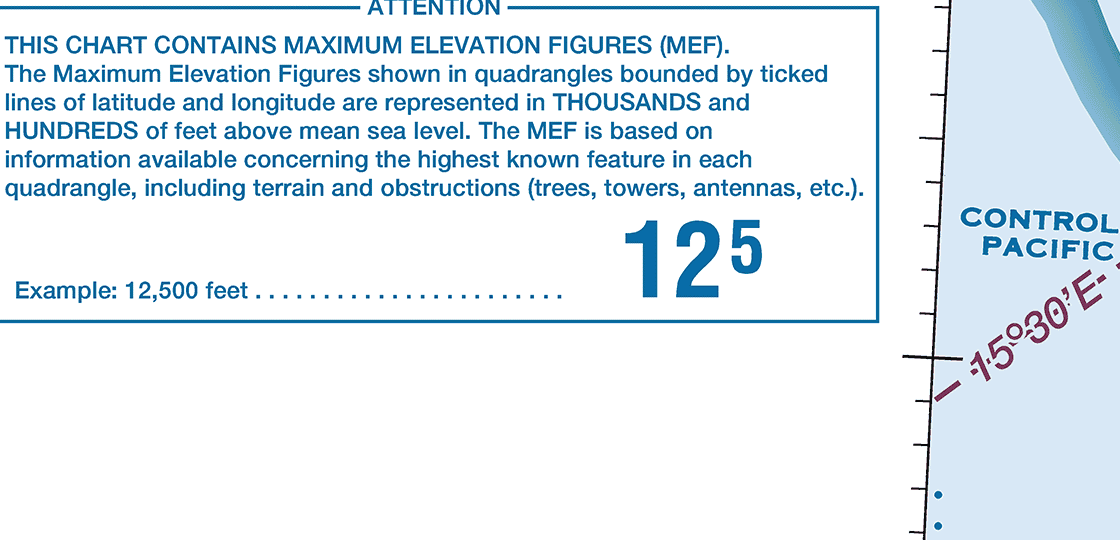
- A. 1,250 feet above mean sea level
- B. 12,500 feet above mean sea level
- C. 125 feet above ground level
Answer: B. The chart legend states that MEFs are shown in hundreds of feet above mean sea level. Multiply 125 by 100 to read 12,500 feet MSL.
Continue learning
Go deeper with Part 107 Weather & Charts Mastery.
Use the course outline and available free preview to decide whether the lesson format fits your study plan.
View the related courseRelated study guides
Continue with the next FAA knowledge area that supports this planning decision.
Part 107 airspace and sectional chart questions explained
A practical framework for Part 107 airspace and sectional chart questions: locate the feature, read its chart legend and altitude information, then apply the operating rule and current restrictions.
Read related guidePart 107 Airspace Classes Guide
A practical FAA-source guide to controlled airspace, authorizations, LAANC, and UAS Facility Maps.
Read related guideOfficial FAA sources
Next step
Put the concepts into practice.
Take the free, self-paced practice exam to identify which knowledge areas to review next. No email is needed to start or finish.